
A fintech dashboard that turns raw transaction data into decisions in seconds.
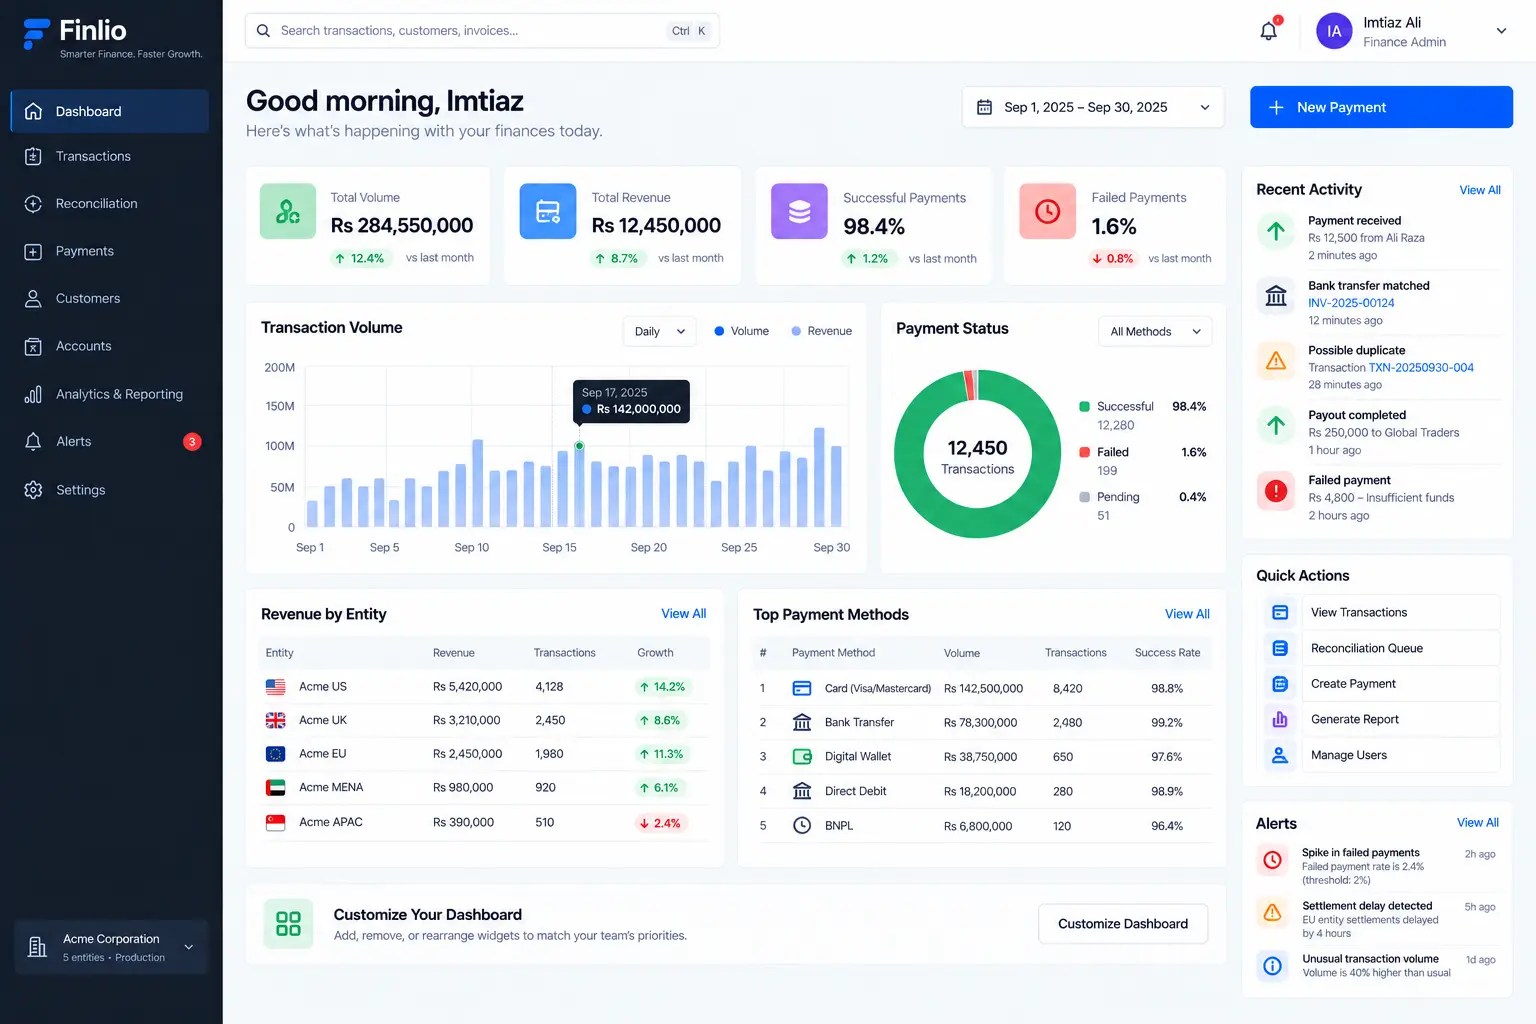
We designed and built Finlio's analytics and operations dashboard, a real-time view of payments, reconciliation, and reporting that replaced overnight spreadsheets and gave every team the numbers they need, live.
- Client Finlio
- Industry B2B payments
- Timeline 14 weeks
- 24h → real-time
- Data refresh, from overnight batches to live streaming
- −41%
- Time spent on daily reconciliation
- 1.4s
- Median dashboard load, down from 6s
- +38%
- Weekly active users in the first quarter
Project at a glance
- Client
- Finlio
- Industry
- Fintech · B2B payments
- Engagement
- UX design & full-stack build
- Timeline
- 14 weeks
- Platform
- Web app · responsive
- Team
- Design, frontend, backend
The challenge
Decisions were stuck behind yesterday's data
Finlio processes payments for hundreds of business customers. As it grew, the tools its own teams relied on couldn't keep up, and the cost showed up as slow decisions and manual work.
Critical numbers lived in overnight batch reports, so teams were always acting on yesterday's data.
Reconciliation meant exporting CSVs and matching payments by hand across several systems.
Every new report was an engineering ticket, creating a backlog that slowed the whole business.
Sensitive financial data had no fine-grained access control or audit trail.
The solution
One live dashboard, built around the decisions that matter
We rebuilt Finlio's reporting from the data up: a streaming pipeline feeding a fast, role-aware dashboard, shipped in four stages.
- 01
Discovery & data mapping
We shadowed Finlio's finance and ops teams, mapped every data source (payment processors, ledgers, the core banking API), and agreed on the handful of metrics that actually drive decisions.
- 02
UX design & prototyping
We designed an information hierarchy that puts the day's critical numbers first, then prototyped the key flows in Figma and tested them with real users before writing production code.
- 03
Streaming data architecture
We replaced overnight batch jobs with an event-streaming pipeline, so the dashboard reflects transactions within seconds while staying accurate and idempotent under load.
- 04
Build, harden & handover
We shipped in reviewable iterations, added role-based access, alerts, and audit logging, load-tested the whole thing, and handed over typed, documented code Finlio's team owns.
What we built
The features that made the difference
Every capability earns its place by removing manual work or shortening the path from question to answer.
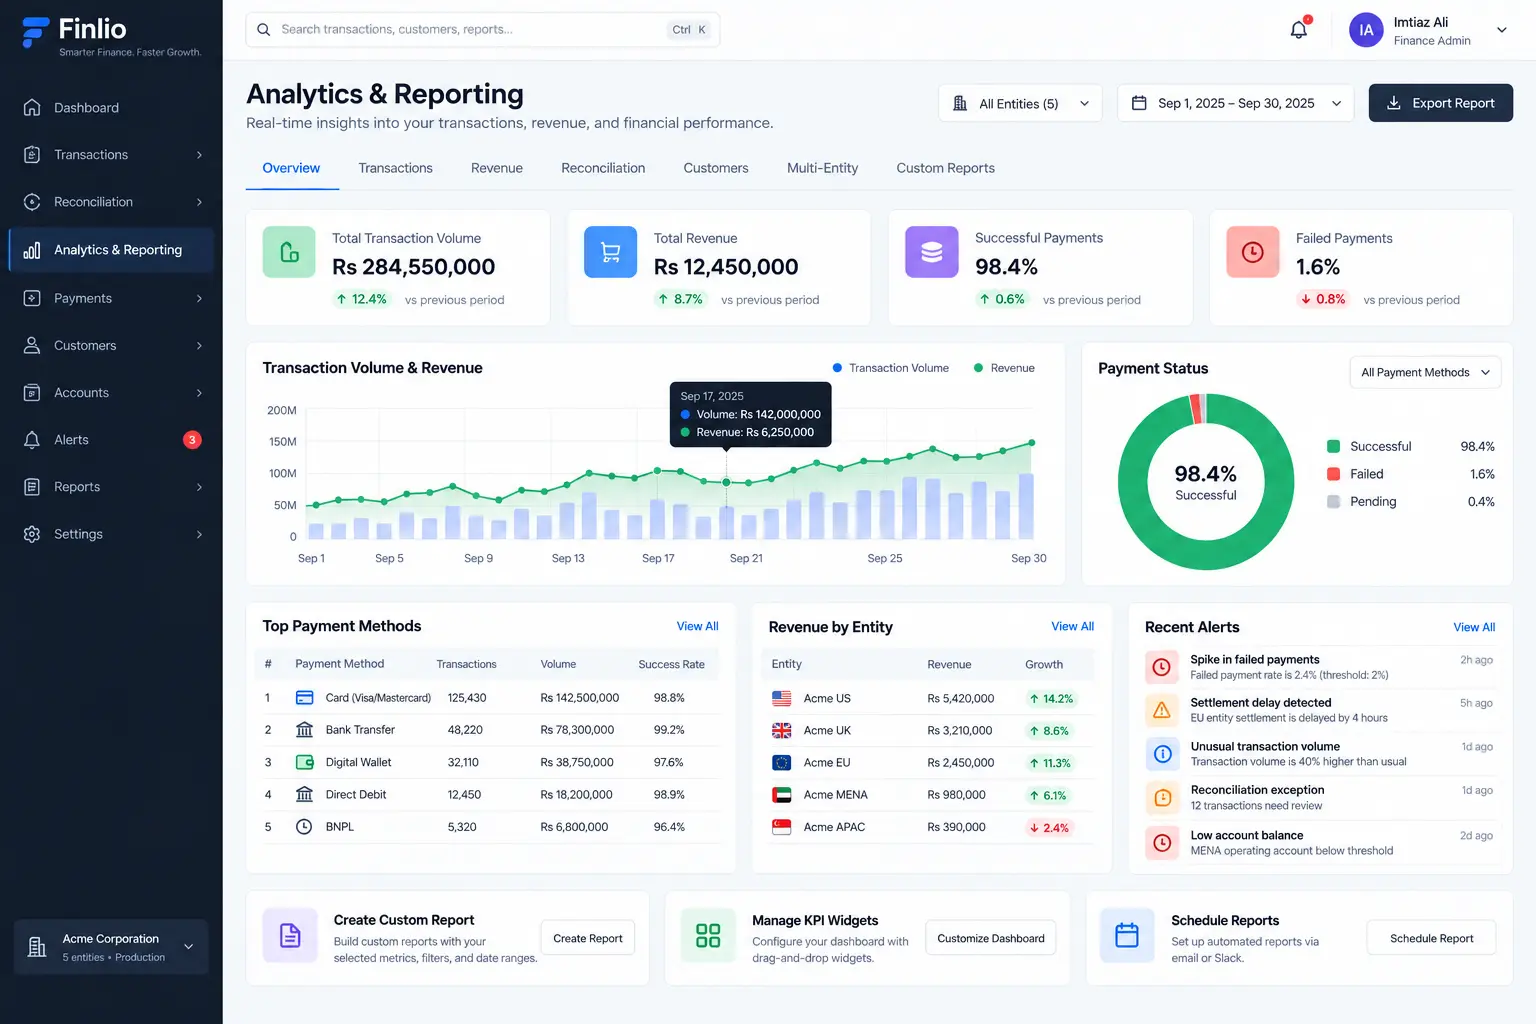
Real-time transaction analytics
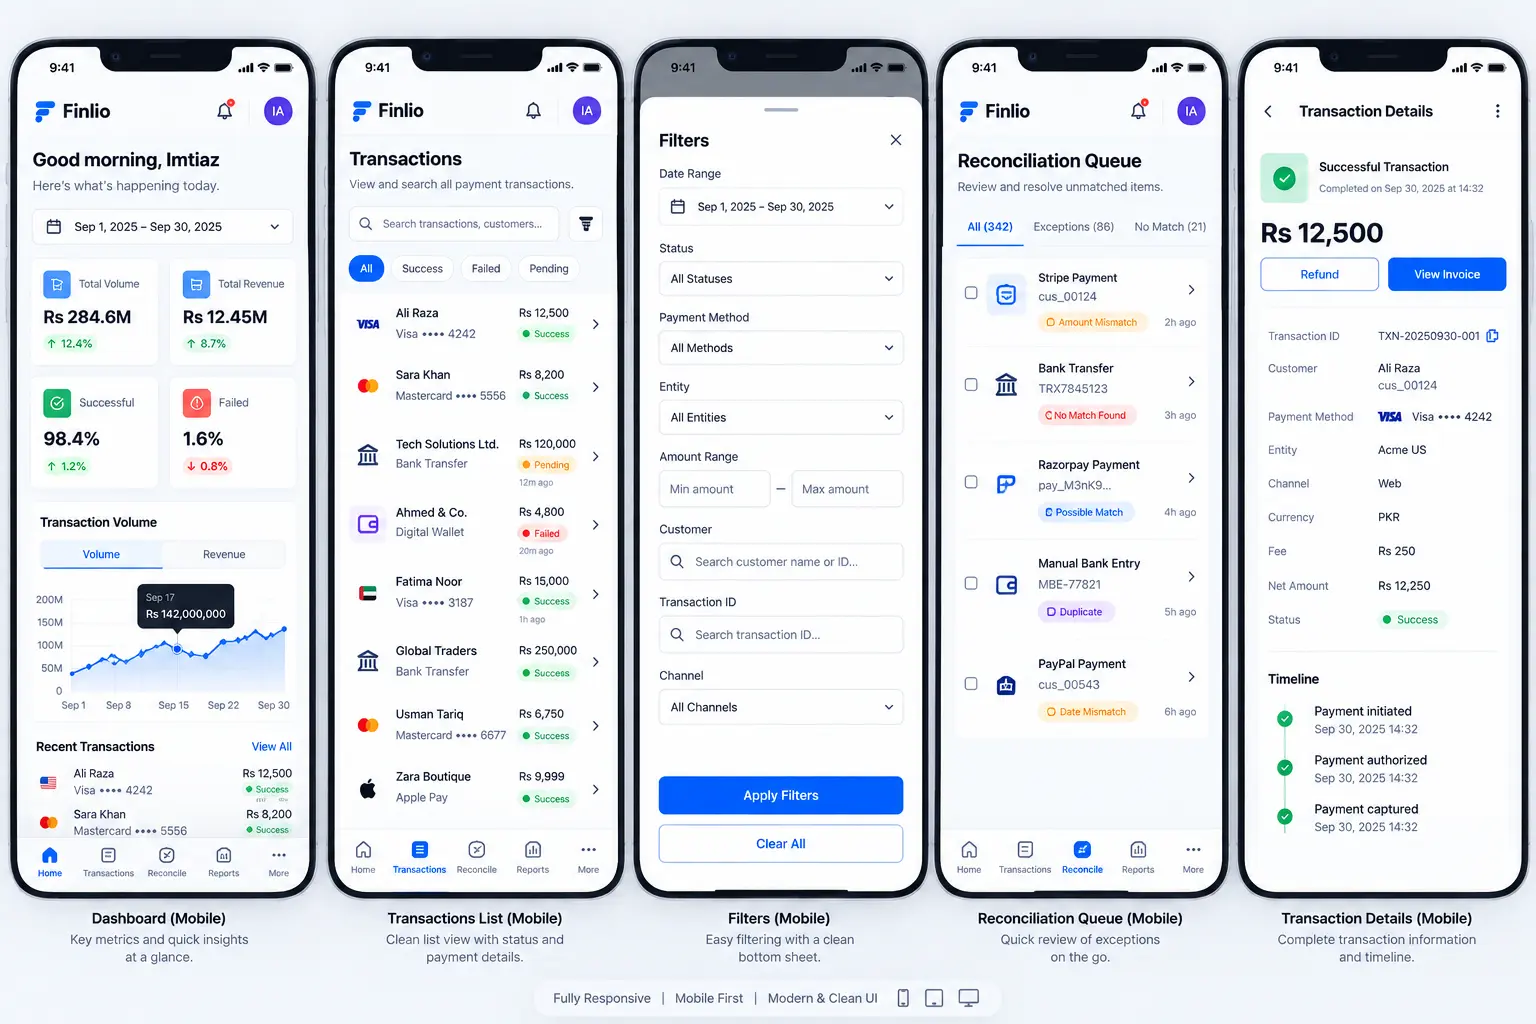
Live charts for volume, revenue, and settlement, streamed as events land instead of waiting on a nightly batch, so finance teams act on what's happening now.
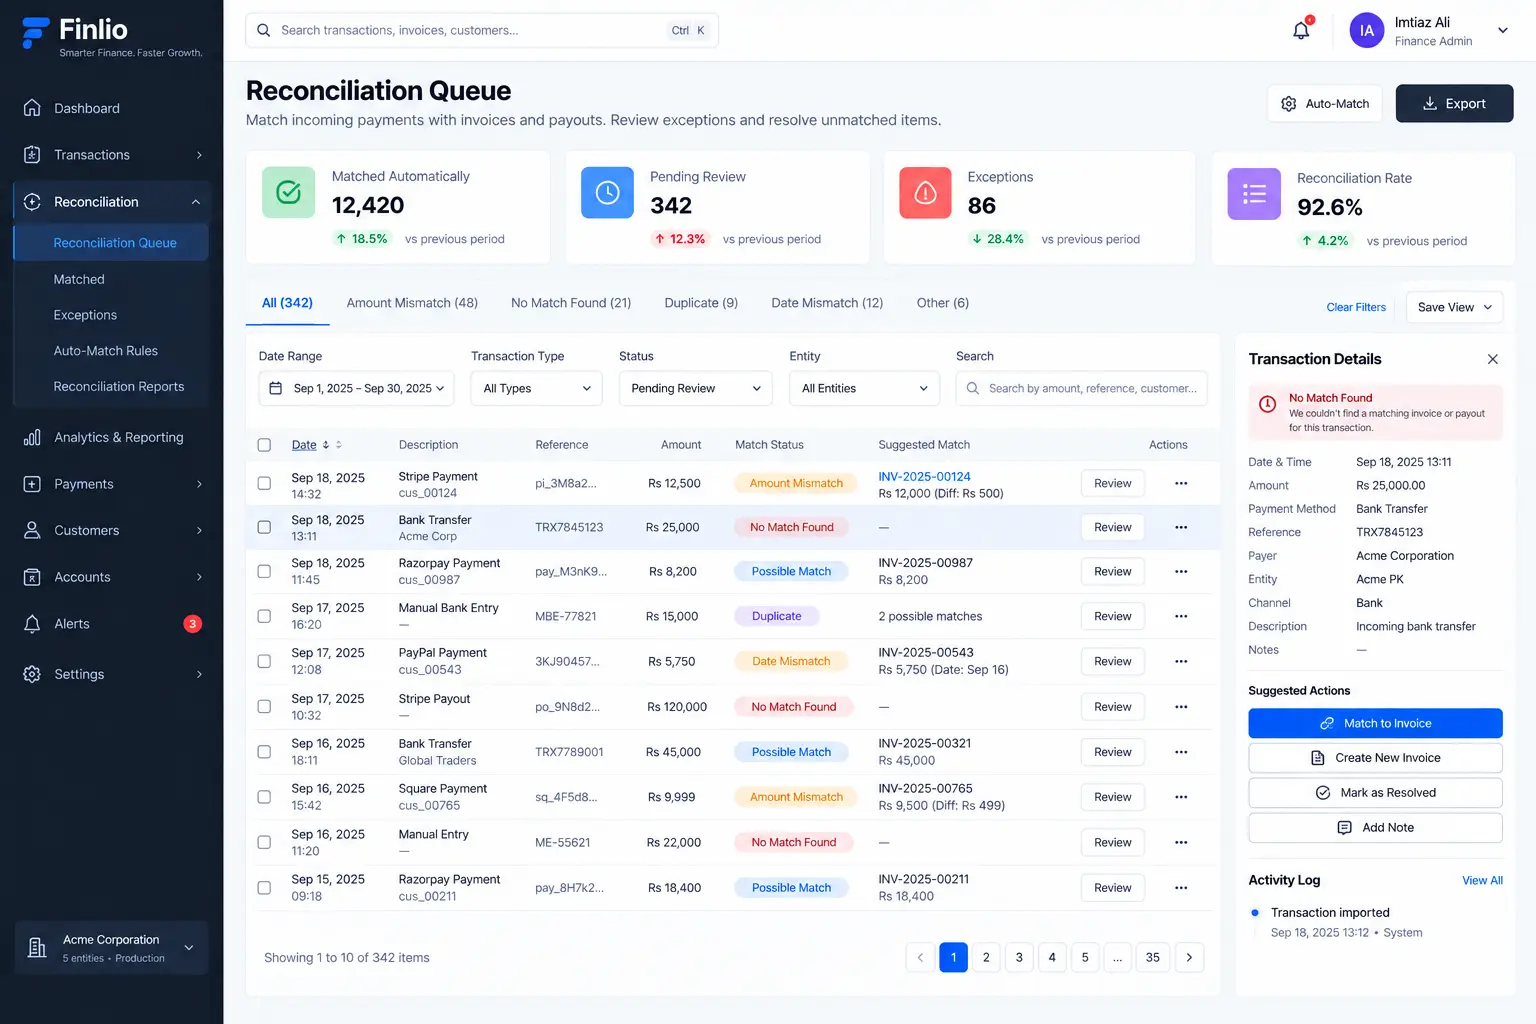
Automated reconciliation
Incoming payments are matched to invoices and payouts automatically, with exceptions surfaced in one queue, cutting a manual, spreadsheet-heavy process down to a review.
Configurable KPI widgets
Each team builds its own view from a library of drag-and-drop widgets (MRR, churn, chargebacks, cash position) without waiting on an engineer to ship a report.
Threshold alerts
Rules watch for anomalies, like a spike in failed payments or a drop in settlement rate, and notify the right people over email and Slack before small issues become incidents.
Role-based access & audit
Granular permissions keep sensitive financial data scoped to the right roles, and every view and export is logged for compliance and internal audit.
Multi-entity reporting
Finlio's customers operate across regions and legal entities; the dashboard rolls them up into one picture or drills into any single entity in a click.
A closer look
Inside the dashboard
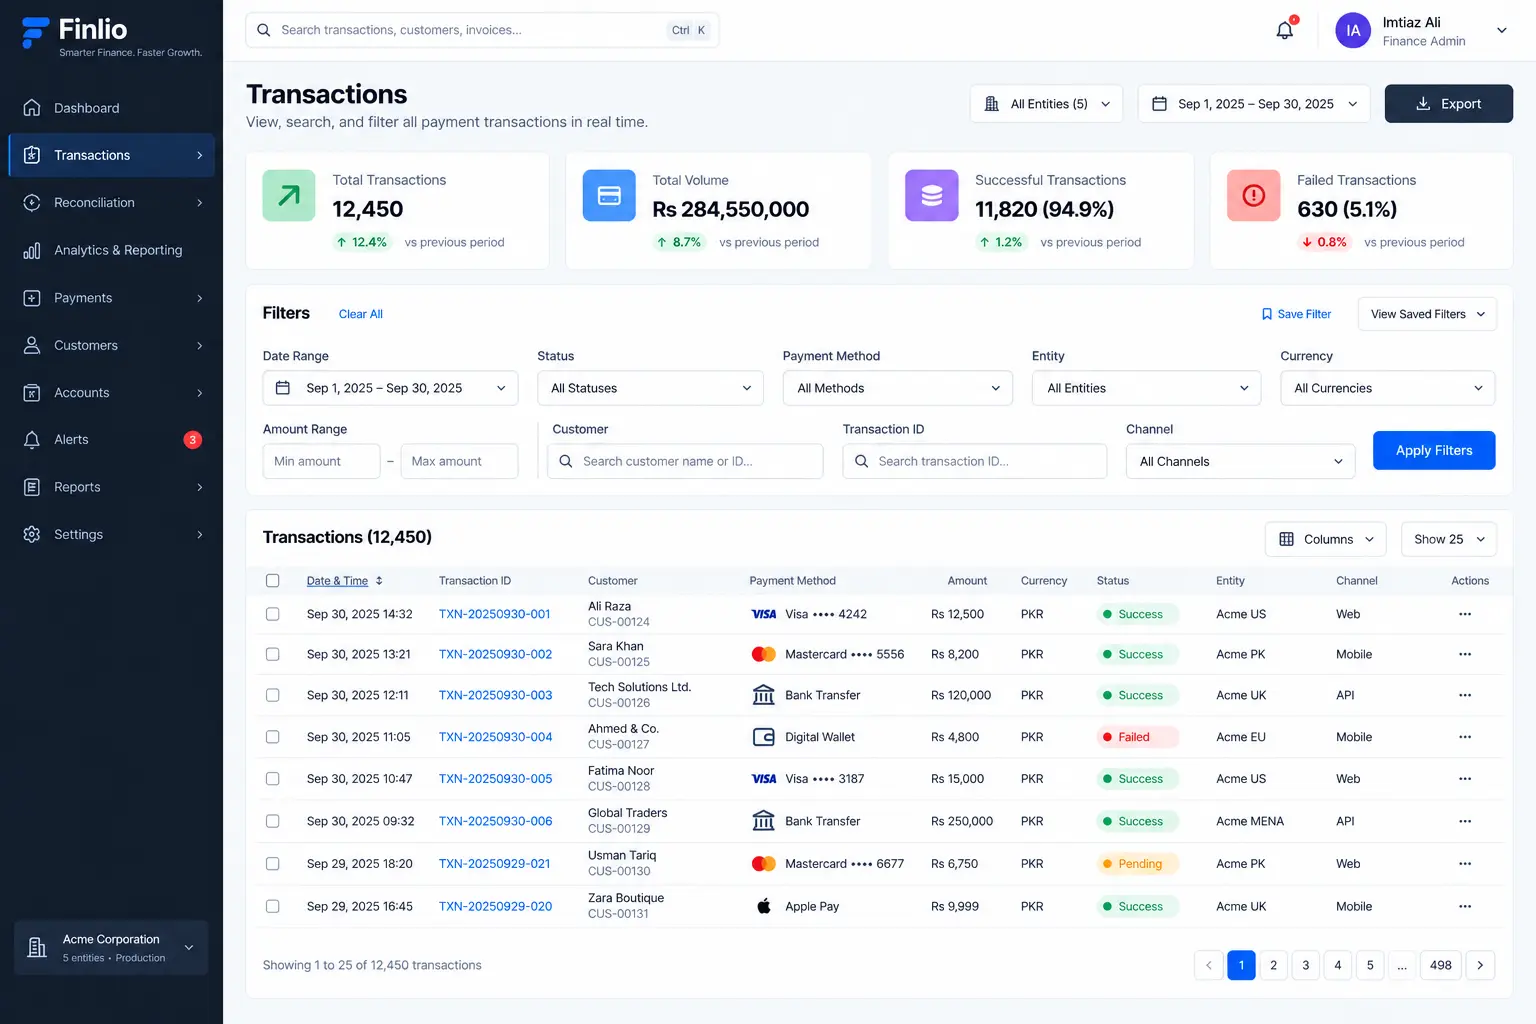
A few of the core screens, from live analytics to the reconciliation queue.
The results
Faster decisions, less manual work
Within a quarter of launch, the dashboard changed how Finlio's teams work day to day.
- 24h → real-time
- Data refresh, from overnight batches to live streaming
- −41%
- Time spent on daily reconciliation
- 1.4s
- Median dashboard load, down from 6s
- +38%
- Weekly active users in the first quarter
- Finance closes the day in minutes, not hours
- Reporting requests to engineering dropped to near zero
- Anomalies are caught by alerts before customers notice
- Every export is scoped by role and fully audited
“We used to start every morning reconciling spreadsheets. Now the whole team opens one dashboard and just knows where we stand. It paid for itself in the first month, and the code is clean enough that our engineers keep building on it.”
- Next.js
- TypeScript
- React
- Tailwind CSS
- Node.js
- PostgreSQL
- Apache Kafka
- Redis
- TimescaleDB
- AWS
Let's build something worth shipping
Tell us what you're working on. Book a call to talk through it, or send a few details and we'll get back to you with next steps.